Diagnostics
On the Diagnostics page, you can find the tools to check the overall status of your system. It allows you to monitor and test your setup to identify faulty units, and helps you solve issues. To access Diagnostics, click the ![]() icon in the side menu.
icon in the side menu.
Overview
On the Diagnostics page, you can perform different actions. The image below gives an overview of all possible actions. The sections that follow give a detailed description of how to use all these features.
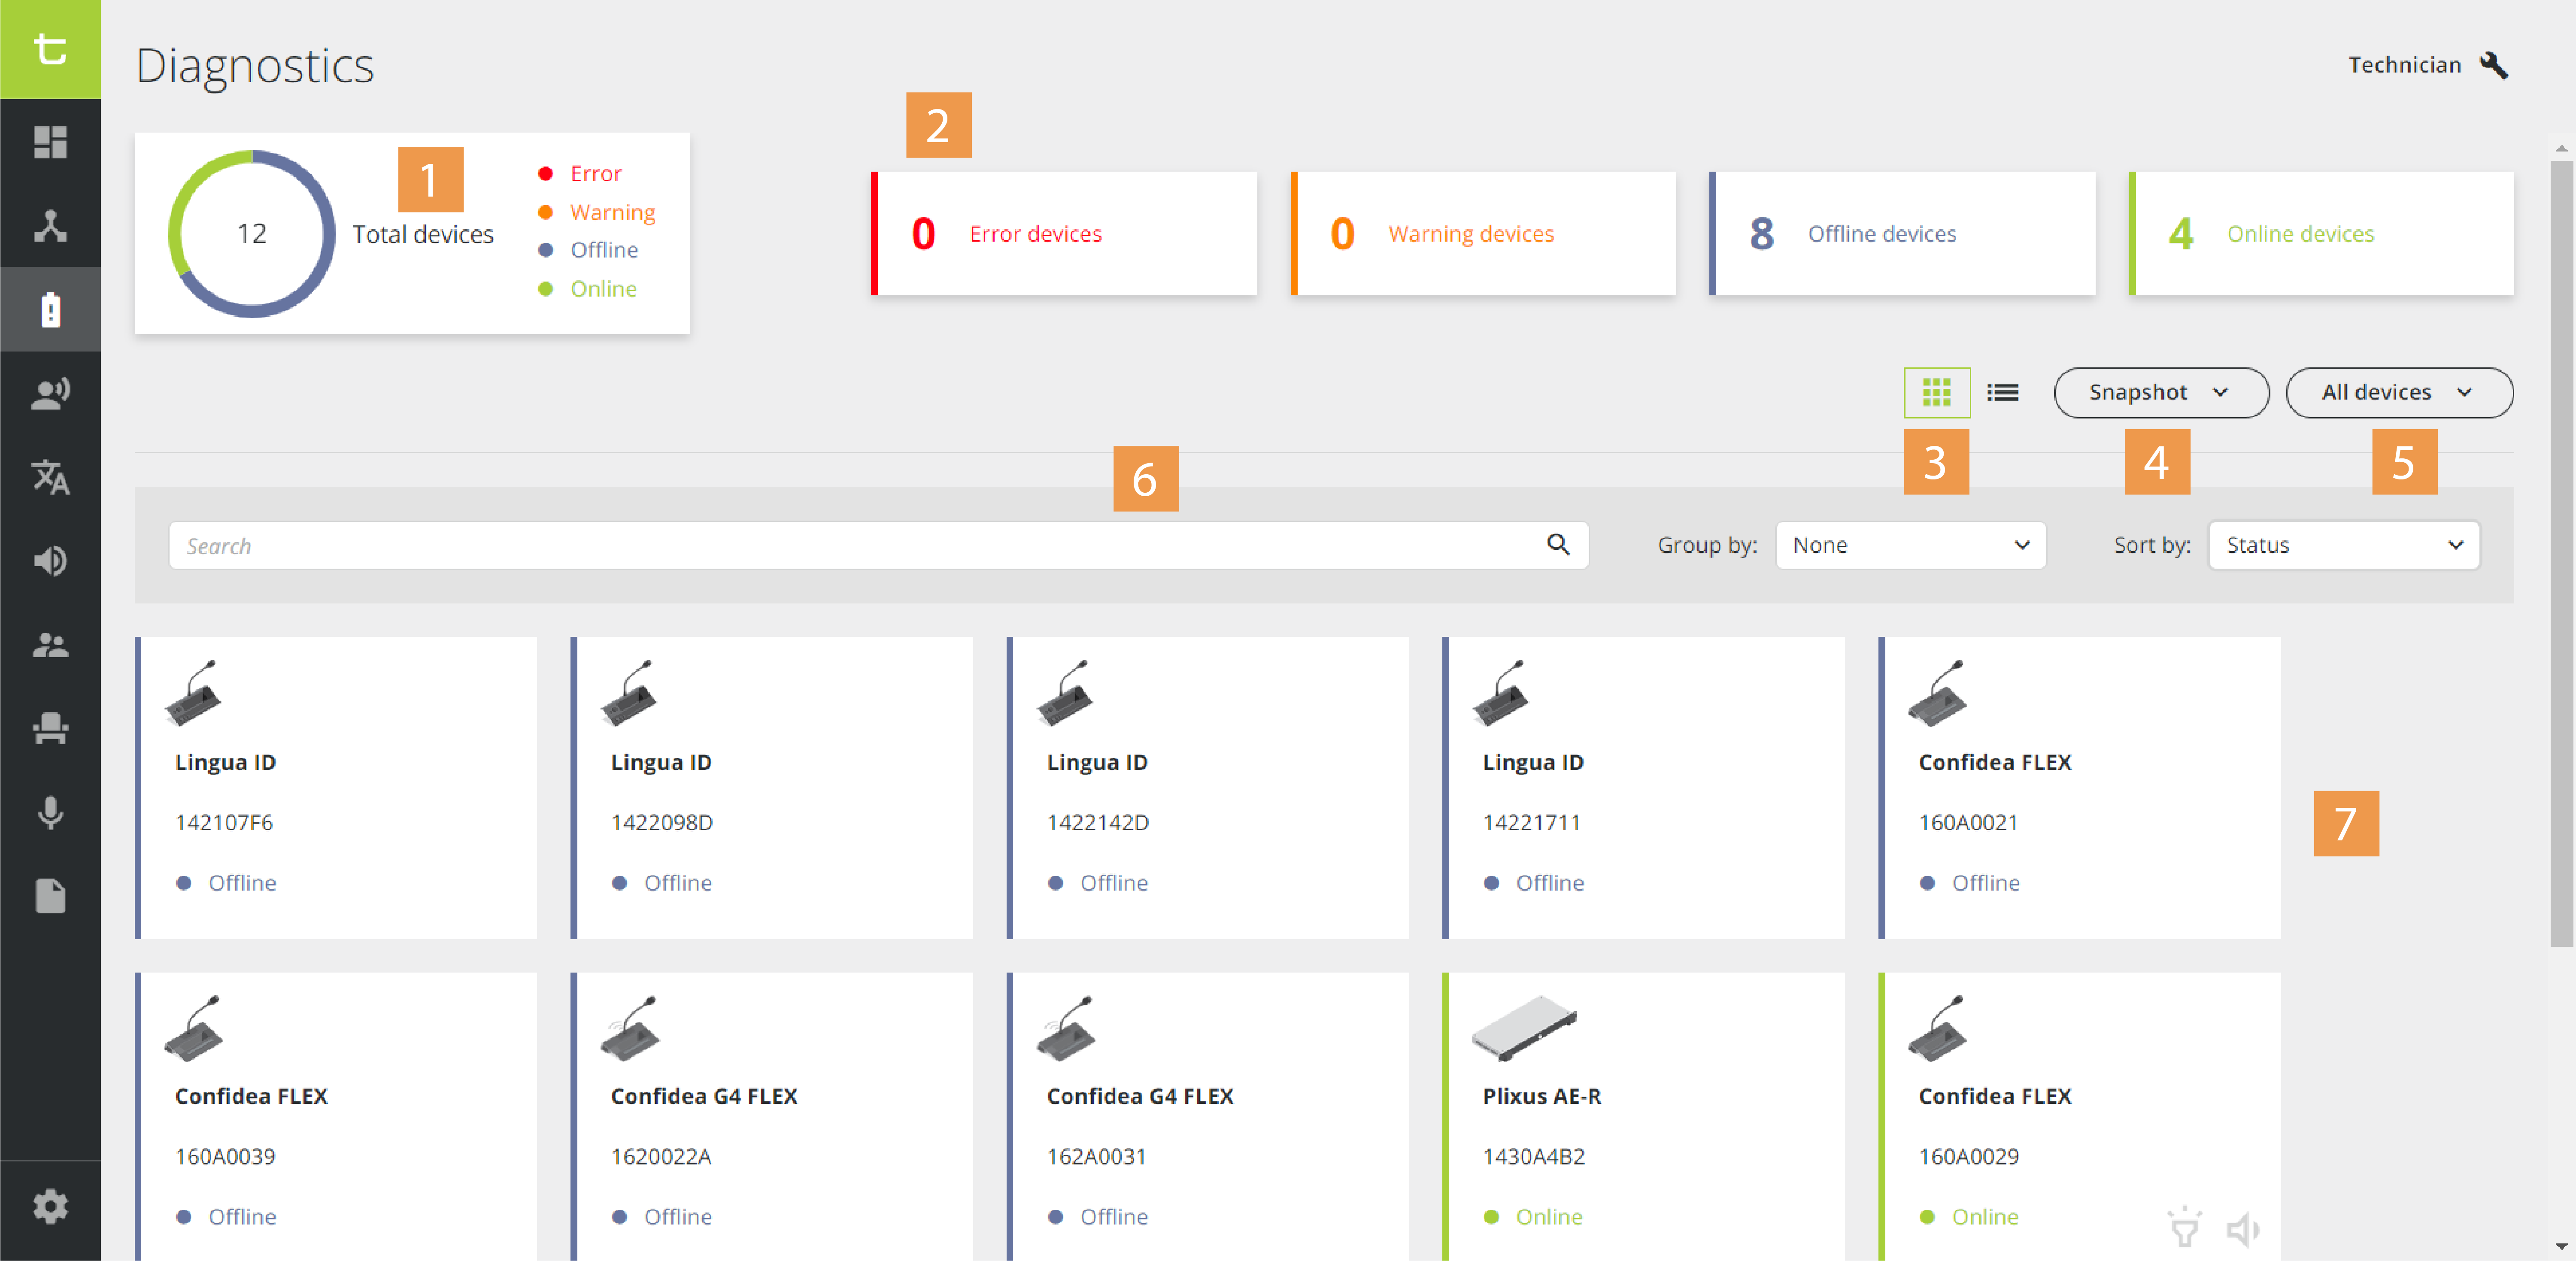
Figure 1-1: Diagnostics page to monitor all devices in your system
- Quick of the system status: shows a pie chart with the total amount of devices, including all central equipment such as the engine and the network extenders, and the amount of devices per device status.
- Quick filters: click one or more of the filter buttons to show the devices with a specific status.
- Change view: show the devices as tiles or as a list
- Take a Snapshot of your system: creates a JSON file containing all system information on the moment you take the snapshot.
- Highlight all devices: click this button to highlight all devices (those that support this feature). This lights up the LED ring of the microphone and the LEDs next to the microphone button.
- Search bar: use this function to search for devices, group by Loop/Branch or sort the devices.
- Device list: shows all devices of the setup as a list or as tiles (depending on the view you selected). For every device you can see:
- The type of device
- The serial number
- The status
- The battery level
- The USB power
- The total time remaining
- The signal quality
- Different actions such as Highlight or Test (only for devices that support this feature)
Specifics for List view
When you choose to visualize the devices in the list view, you will get a few more details that are not visible in the tile view.
- Battery A status: percentage of battery life remaining for battery A.
- Battery B status: percentage of battery life remaining for battery B.
- Total time remaining: remaining battery life in hours or minutes.
- Signal quality: connection quality of the units to the access point.
Filter
The Diagnostics application has different options for filtering out specific devices.
Using the filter buttons
On top of the application, there are four filter buttons available:
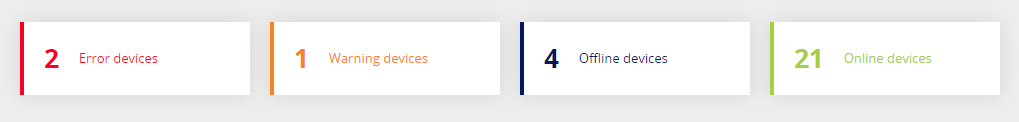
- Error devices: the device is not functioning properly, for example it is stuck in golden mode.
- Warning devices: the device has a warning, typically this is due to low battery (mostly seen in wireless units). Low battery will be indicated by a red warning sign
 to show that you need to charge the battery.
 - Offline devices: the device has lost connection to the central unit
- Online devices: fully operational device
Select one or more buttons to add the devices to your selection in the device overview section. Once you click a button, it becomes highlighted. Click the button again to remove the devices from the selection.
Using the search function
Use the search bar to find specific devices. You can use the device type or serial number to find specific devices. The search function works dynamically and the search result updates in real-time while you're typing.
Visualize loops and branches 
In the Diagnostics application, you can group devices based on the loop/branch they belong to. With this option, you can see when a loop is broken because then the loop becomes a branch. To see the loops/branches, select Loop/Branch under Group by next to the search bar.
For every loop/branch, you can see the serial number of the device the loop/branch starts/ends in the header of the group. The order of the devices in the overview is the same as in the actual loop/branch present in the room. For a loop, this means that the first device in the list is directly connected to the first device in the group header, and the last device in the list is connected to the second device in the group header, as shown by the orange line.
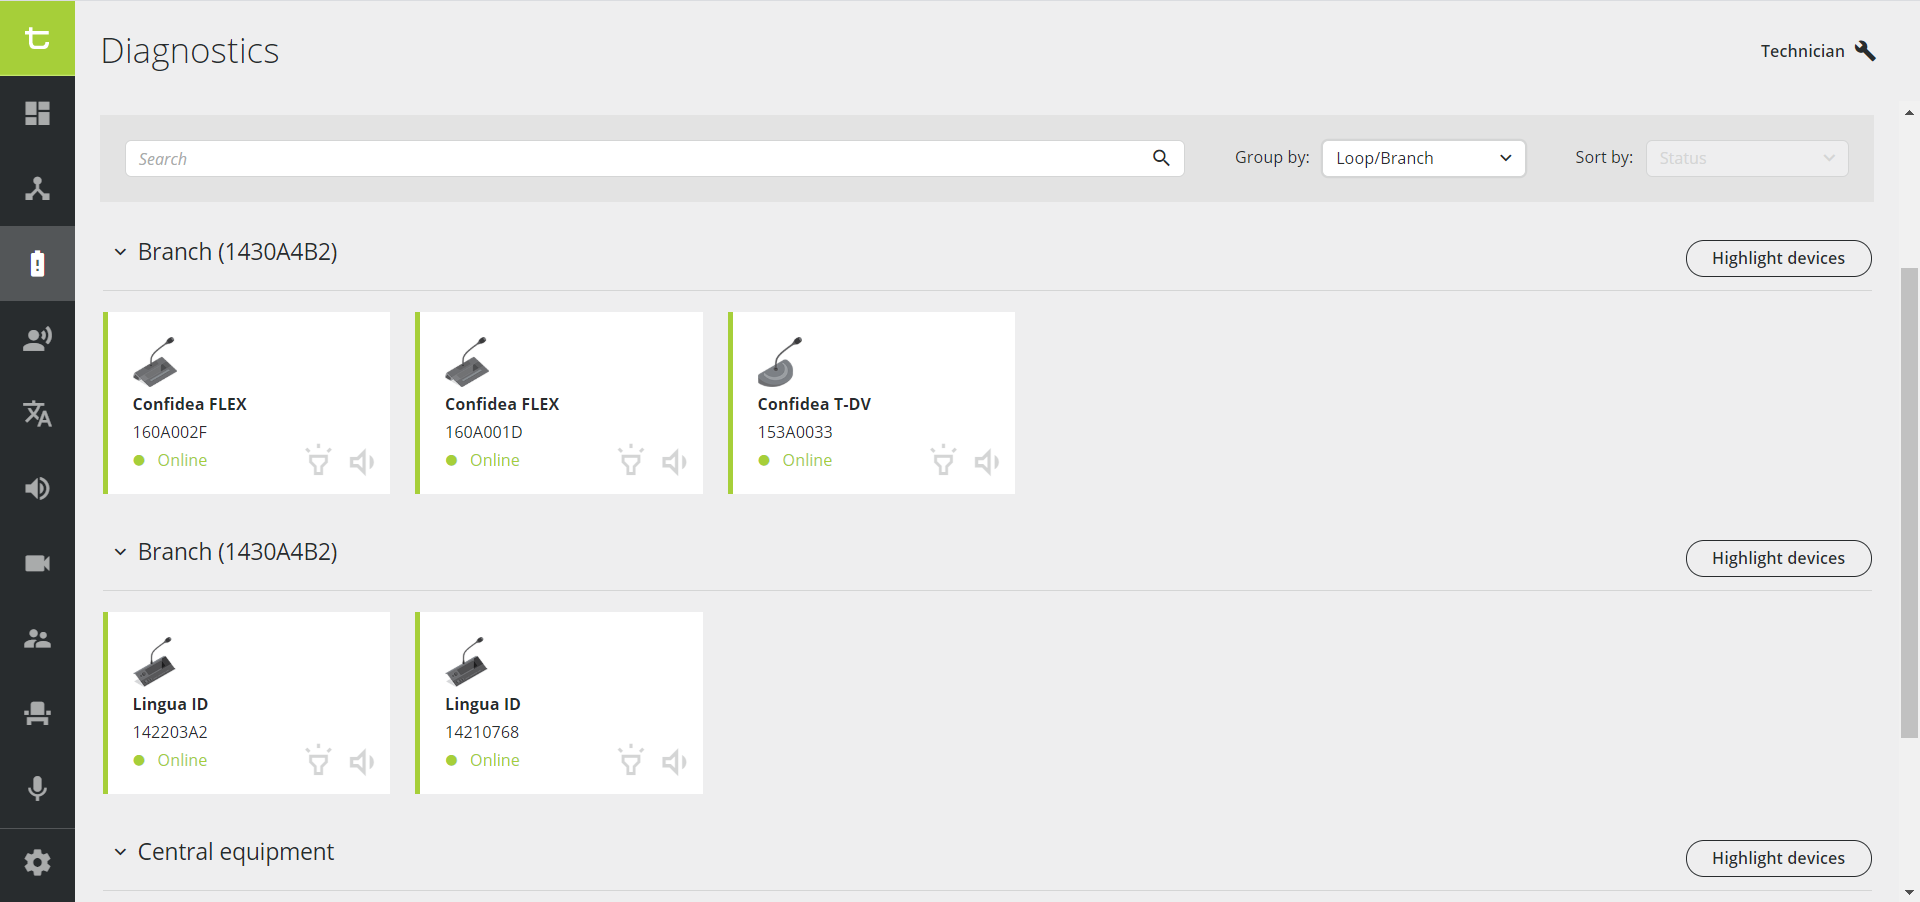
Figure 1-2: The order of the devices in the loop/branch group corresponds to the actual order of the units in the setup, meaning the first device is connected directly to the device next to it in the visual representation
View device details
When you click a device in the overview with all devices, a window pane appears on the right. This pane shows the following device information:
- Firmware version (golden)

- Firmware version
- Software version
- Boot status
- Device status
- Battery statuses

- Signal quality

- Option to highlight and test the device (only for devices that support this feature)
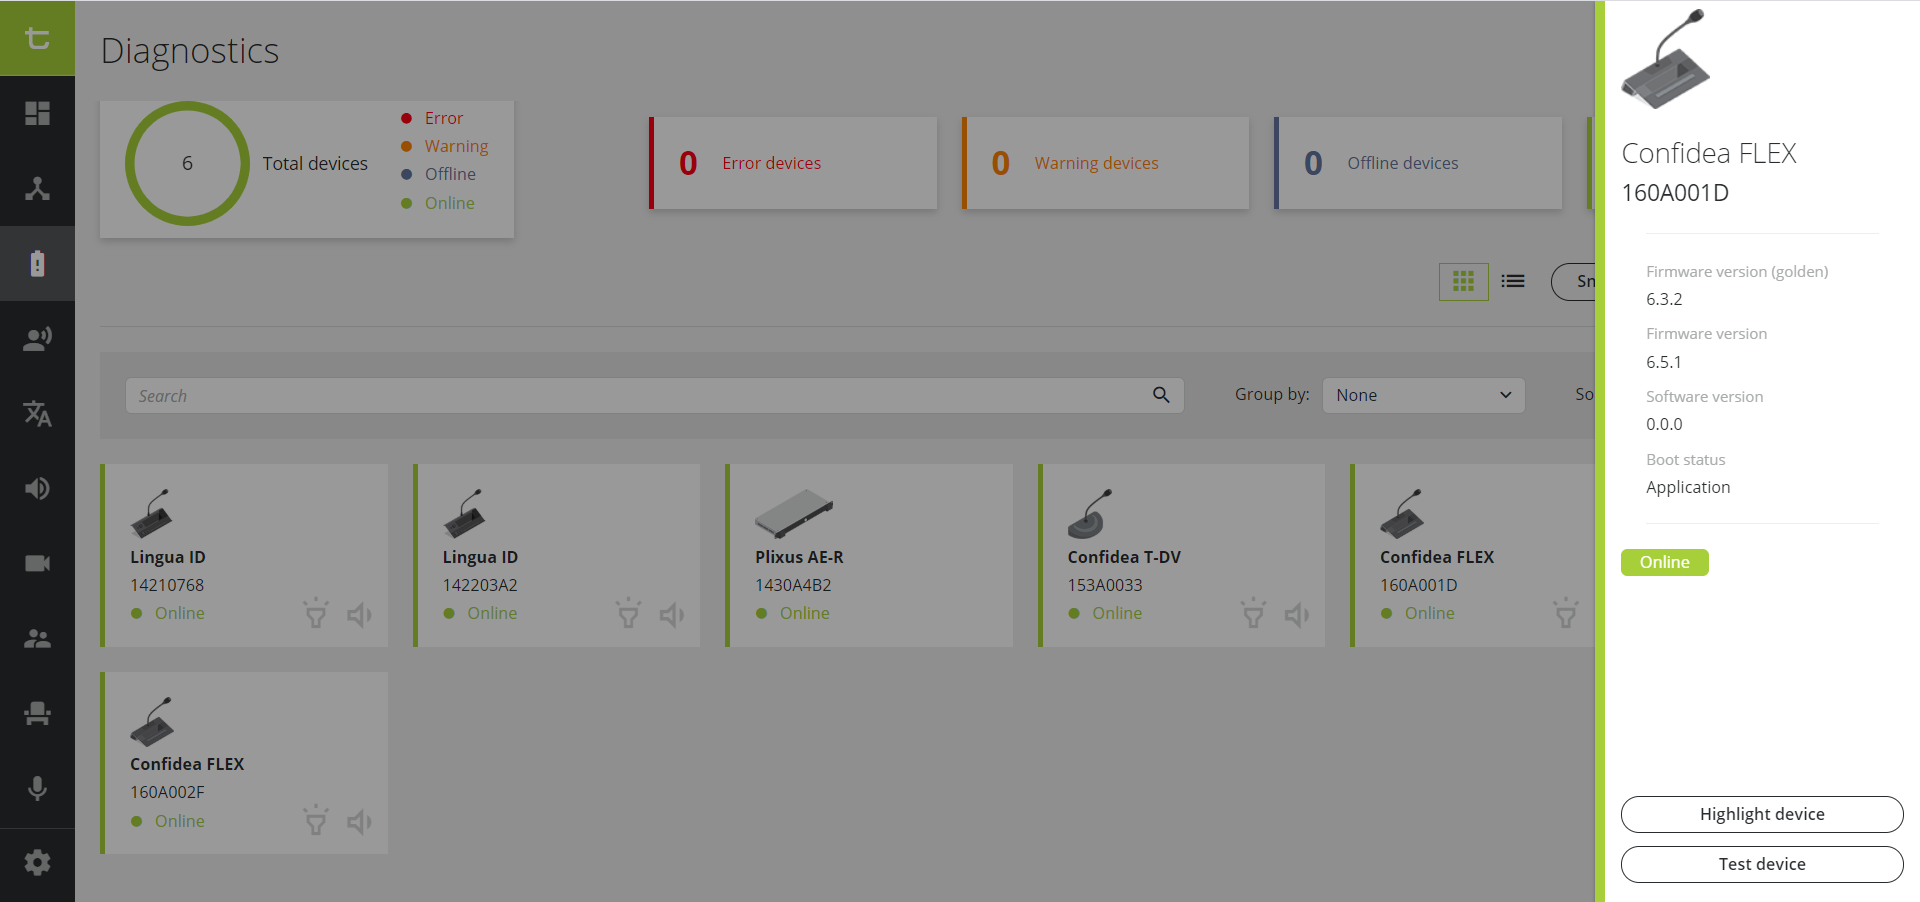
Figure 1-3: Device details pane in the Diagnostics application for wired
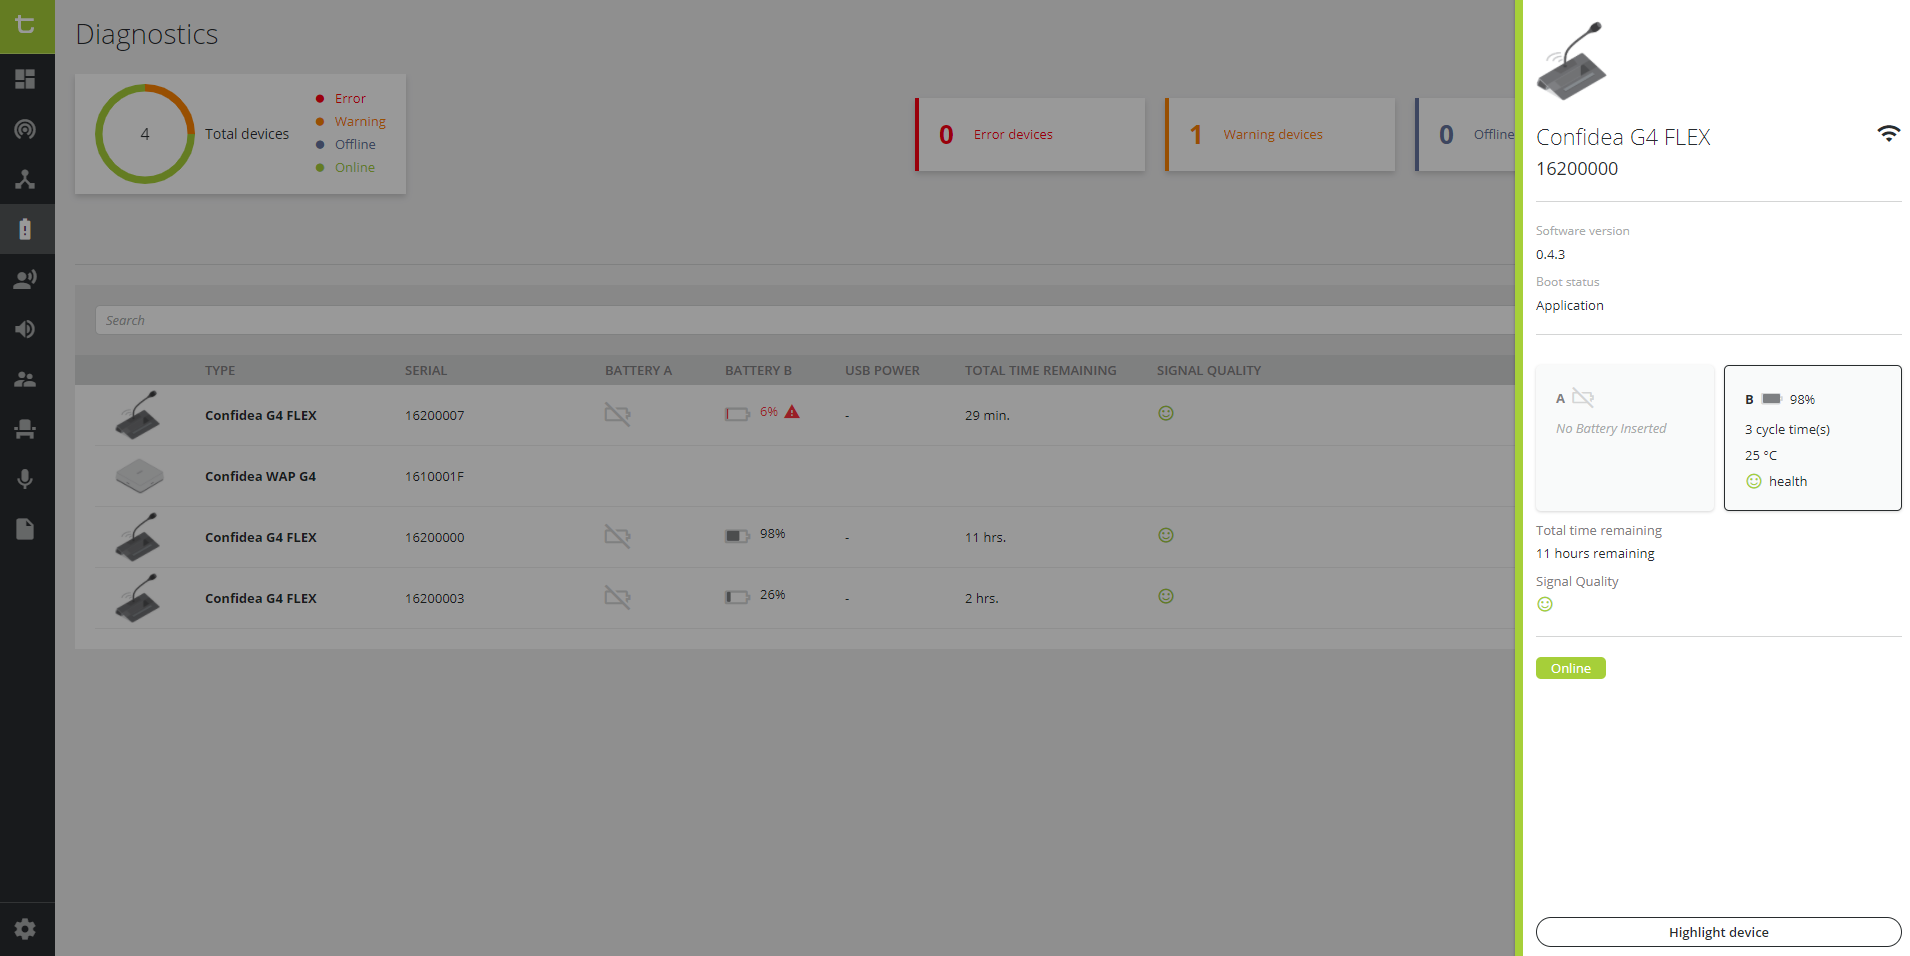
Figure 1-4: Device details pane in the Diagnostics application for wireless
Highlight devices
Confero offers a useful option to highlight one or more devices in your system. Highlighting devices allows you to identify specific devices in your setup and see where they are located. When you highlight a device, the LED ring of the microphone and the LEDs next to the microphone button light up.
Not all devices support the highlighting feature, only the devices with LEDs. Currently, it is only possible to highlight discussion units with a microphone and a uniBOX setup, that are online with or without warnings.
Highlight a single device
There a two options to highlight a single device:
- In the tile or list view: click the highlight icon
 to activate or deactivate the highlighting
 - In the device overview, click the device to see the device details. On the bottom of the window pane that appears on the right, click Highlight device.
Highlight all devices
To highlight all devices at once, click the button All devices in the upper right corner and select Highlight all devices. This highlights all online devices without errors that support this feature. To stop highlighting, click the button All devices again, and select Stop highlighting all devices.
Highlight all devices in a branch/loop
In Diagnostics, it is possible to visualize the devices as branches and loops. For more information on how to do this, see Visualize loops and branches
Next to every loop or branch, you can find the button Highlight devices. Click this button to highlight all devices in this loop/branch. In the loop/branch, you can stop highlighting individual devices to see which device is which in your setup.
Test device
Using the Diagnostics application, you can test the devices. In Test mode, you send a sinus test tone to the device you want to test. The speakers of the device you are testing should then play this tone. You can also test the microphone of the unit, the loudspeaker of the other units then play the audio captured by the microphone of the tested device.
There are two options to test a device:
- In the tile or list view: click the test icon
 to activate the test mode
 - In the device overview, click the device to see the device details. On the bottom of the window pane that appears in the right, click Test device.
In test mode, you are disconnected. Therefore a pop-up appears to confirm you want to go into test mode. When you are in test mode, the browser displays an orange header indicating the system is in test mode. In this header, there is also an option to disable the test mode. You can also disable the test mode by clicking the test icon ![]() again.
again.
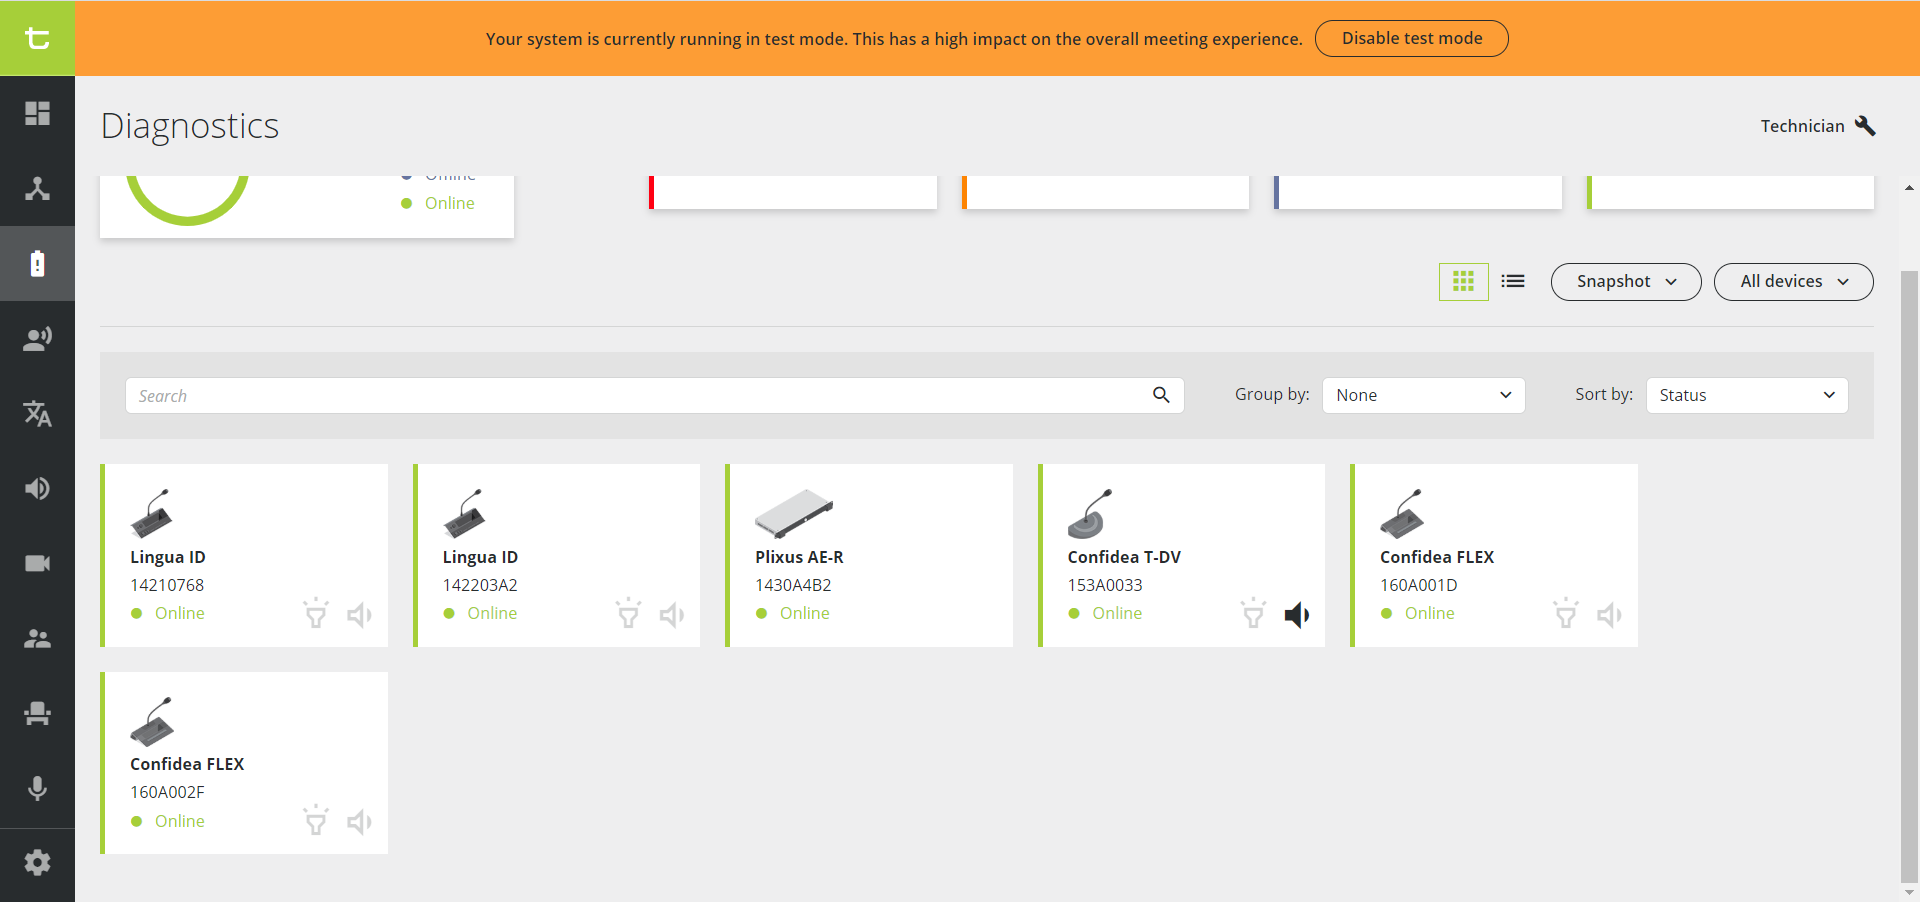
Figure 1-5: Diagnostics application in test mode. The orange header on top indicates that the system is in test mode.
Not all devices support the test feature. Currently, it is only possible to test online devices without errors with a microphone and/or speaker.